A patient gave me some really good advice the other day: She said, “Dr XXX, now your kids still young, wanna go anywhere just go la! Next time go to school very hard already!”
I’ve just came back from a trip barely 1 month ago, but I guess that advice really made sense to me. (Or perhaps I just want it to make sense. The mind sees whats the heart wants right? haha)

So, it looks like I’m gonna have to break the promise I made myself, which is no more travelling for the rest of the year as I try to get more work done. It’s kinda indicative that I might be having too much fun when on the plane back, my son asked “papa, so where are we going next?”
He’s barely 4 yrs old and he’s been on 5 trips to 5 different countries, with probably a 6th scheduled this year. I think I only made the 1st ever trip out of the region when I was… in my mid 20s. Kids these days are living better and better.
With the flurry of results that were released last week, I’ve only had time to work through 2: BBR Holdings and Geo Energy Resources. So here’s my quick take down on what transpired.
BBR Holdings. I’ve recently written about how they’re likely to show a turnaround, earnings wise, in FY17, with the contribution from Lakelife EC.
BBR Holdings – TTI’s Analysis Of The Latest Happenings
And they certainly did:

Just to give a sense of how much of a turnaround it is:
FY17Q1’s earnings alone, is about 3 times that of FY16 Full Year’s earnings!
EPS in Q1 alone is 1.75 cents, and if the company continues at this rate (highly unlikely), full year earnings would be 7 cents per share, which would be multi year highs. It is highly unlikely that would transpire though, I’ll elucidate why later.
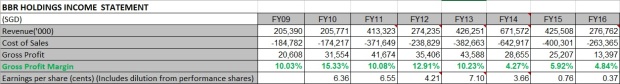
As we can see here, the long term track record of earnings looks like this:
FY10: 6.36 cents
FY11: 6.55 cents
FY12: 4.21 cents
FY13: 7.10 cents
FY14: 3.66 cents
FY15: 0.76 cents
FY16: 0.37 cents
So with FY17Q1’s 1.75 cents, management will really have to screw up the next 3 quarters to avoid showing an improvement in earnings from FY16 huh.
The problem is, there is a chance they really could do that…
Breaking down the earnings picture further, we see that the company raked in $5.54mil in profits in Q1. Of this $5.54mil, the lakelife EC project contributed $5.78mil.
Yup, that’s right. The project contributed more than what the group earned, meaning that BBR Holdings (less Lakelife) was very unfortunately, STILL bleeding money in Q1.
The devil is ALWAYS in the details. Damnit.
This is a major disappointment for me. I’ve always maintained that the basic premise of my investing thesis lies in the fact that I’m expecting BBR Holdings to stop bleeding money in its general construction projects. It’s been 2 years and counting for gods’ sake!
The only silver lining from this, and I’m really grasping at straws here, is that the loss (excluding lakelife), would have narrowed to an almost negligible $0.2mil.
On top of that, the company has recognized earnings from 296 units in 2016, and now, in FY17Q1, they’ve recognized earnings from a further 194 units. That means there’re 56 units left to be recognized, probably in Q2.
My rough estimation (which has been fairly accurate thus far) is that these 56 units would contribute approximately $1.6mil in Q2.
Other parameters came out to be fairly acceptable. FCF was flat in Q1, but that’s because the company spent $1.4mil on a new storage facility for their PPVC units. Going forward, PPVC is supposed to be a major competitive edge for the company.
Now, they are certainly not the 1st movers, or the only movers for PPVC. But BBR has had quite a few projects thus far involving PPVC (NTU, Wisteria, housing at Upper Aljunied Road), and as with any new tech, they’d have had a steep learning curve. By now, they should have ironed out any clinks in the workflow, and improve on their efficiency.
By right. <—- emphasis.
If only we have a FF Wong running the show here. If only.
NAV has also increased from 42.48 cents in FY16Q4 to 44.12 cents currently.
This means that the company is currently trading at a mere 50% to book value. Come on, even for builders, that’s considered very very low isn’t it? The share price has risen from $0.16+ to the current $0.22 or so. I think it’s still not reflective of the value of the company though.
Wide discount to book value, minimal debt on its balance sheet, FCF +ve in the last FY.
BBR Holdings has a lot of pluses currently. The 1 and only bug bear that’s dragging down the share price, is the earnings picture. We just need the general construction arm to stop bleeding. Thus far, it’s bleeding longer than I expected, so I shall stop giving any projections.
The current earnings release also did not elucidate any further on their malaysian projects. Nothing on new contract wins, despite having hinted at winning contracts related to MRT2 and other malaysian government contracts. (See my earlier post on that) Current order books stands at 215mil, which is the lowest it’s been in the past 7 years that I’ve data on.
Geo Energy Resources’ FY17Q1 is really interesting. Although I traditionally take a bottom up, focused, deep value approach, for Geo Energy, my modus operandi has always been to focus on the macro picture.
This is because it’s obvious that the current and future coal price is by far the main consideration when it comes to Geo Energy.
Geo Energy Resources Investing Thesis – Part I
Geo Energy Resources Investing Thesis Part II
In this aspect, the markets are pretty forward looking when it comes to Geo Energy.
The company delivered on the earnings front:

On paper, it looks pretty damn impressive. Revenue grew 735%, while earnings flipped from being negative a year, to a massive US$14.5mil.
Yet the share price dropped the next day.
Now, let me try to illustrate a point here.
On InvestingNote, someone said he bought just prior to earnings release, because he’s expecting stellar results, and he hoped to make a quick (probably small too) profit on this.
I warned then, that I’m not so sure that’s going to happen. The problem with this chain of thought is that it’s too simplistic, it’s pretty much level 1 thinking. As a matter of fact, I actually sold 200,000 shares at $0.32 just prior to earnings release.
My rationale for that is more macro in nature. But I was expecting the share price to dip after the earnings release, despite expecting good results all the same. I’ve since bought back the 200,000 shares at a lower price, further lowering my average price.
Now, the problem with thinking “ok, results are going to be stellar. I’ll buy before it comes out, and sell after it comes out for a quick profit”, is that EVERYONE knows the results are going to be good! Which is why I said that’s level 1 thinking.
It’ll only work out if you know and everyone doesn’t. Or if everyone expects it to be good, but it turns out to be SUPER good.
Why then did I sell 200,000 shares, and was confident I’d be able to buy back at a lower price?
The macro picture.
The company increased it’s average selling prices in FY17Q1, from US$38.93/tonne in FY16Q4 to the current US$39.45/tonne.
The slight disappointment is that they moved about 2.2mil tonnes of coal in Q1, vs 2.36mil tonnes of coal the previous quarter. The reason for the slight dip is that seasonally, it’s been raining and that resulted in some days where mining activity had to stop.
That’s not good, but it doesn’t just affect Geo Energy. Adaro Energy, the largest (i think, or the 2nd largest) coal miner in Indonesia, also gave the same reason for a flat coal production in Q1.
If that’s the case though, we’ve got a bit of a problem.
Because, Q1 is not even the period where Kalimantan has the highest rainfall!

The peak rainfall is usually towards the end of the year, around Q4.
The smaller “peak” each year, coincides with the March, April, May periods. Meaning the rainfall in South Kalimantan (Kalimantan is a big place, the SDJ mine is in the south) increases gradually from Jan to May period, before falling quickly in June, and we’ll have relatively dry days all the way till Nov/Dec when the rainfall received suddenly jumps up to the highest for the year.
So if Q1 rainfall is enough to limit coal miner’s coal production…. hmmm, won’t Q4 be a problem?
I checked the past records for Q1 2017:
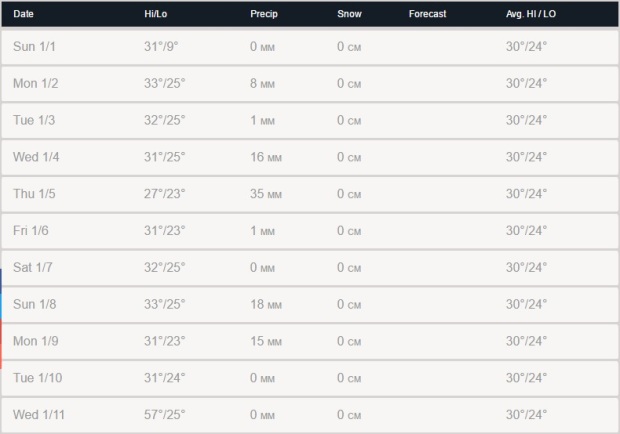
Now, I’ve arbitrary taken 18mm of rainfall as the amount that would disrupt some mining activity for the day.
In Q1, I’ve counted that there are 18 days where the rainfall exceeded 18mm.
In Q2 thus far, and we’re smack in the middle of Q2, we’ve 12 days where the rainfall exceeded 18mm.
So yeah, you can make your own conclusions from this data.
In my personal opinion though, the rainfall, and it’s effect on coal production, is still not the biggest factor. The biggest factor, is of course, the coal prices that Geo Energy can sell it for. I’ve previously described why:
And the forward picture in Q2 is not good. Coal prices have been dipping since the start of Q2. Literally, since the start of April, it’s just been dropping relentlessly.
All credits to sxcoal.com:

On top of that, China’s NDRC has recently indicated that they’re going to limit the import of low quality coal, the bulk of which comes from Indonesia.
http://www.szdaily.com/content/2017-03/16/content_15669775.htm
Essentially NDRC wants to limit the import of low calorific coal. So what exactly is low quality coal?
NDRC didn’t state clearly, except say that it’s usually “high sulphur content” coal , with high ash levels. These are usually the GAR 3200, GAR 3800 coal from Indonesia.
Geo’s coal characteristics, according to SDJ mine’s JORC report (page 21):
89 % of coal tonnes come within a TS range of 0.1 % to 0.3 % x
94 % of coal tonnes VM is greater than 39 % x
81 % of coal tonnes come within an Ash range of 4 % to 7 % x
89 % of coal tonnes GAR Energy come within a range of 3900 to 4300 Kcal/Kg
I’m not sure if Geo’s coal falls into NDRC’s classification of “low quality”. I suspect not. Geo’s sulphur content is well below the 1% limit that China sets.
Alright, so all that is bad news. Now for the good news.
Summer is coming! Traditionally, China’s power usage shoots up in the hot summer months, as the chinese crank up their air conditioners. The power plants know this, and they stock up on their coal stores 1-2 months before that. That means sometime towards the end of May – June, utilities would have to increase their buying.
Most coal traders believe that the utilities would have to pick up their buying towards the end of May. Coal price for GAR 4200 coal is currently being offered at US38-39/tonne at most ports.
The other good news, or rather, potential good news, is that the company is guiding that the acquisition of TBR mine will be completed sometime in 2Q. Personally, I believe they will announce an offtake agreement together with the acquisition. Now, completion of the acquisition of TBR would likely be a major catalyst for the share price, and right now, this is the main catalyst for in my investing thesis.
TBR would mean that the management’s guidance of 10mil tonnes in FY17 would be more likely to be met. And it’d be a major plus for the management’s strategy of amalgamating both plots of mines (SDJ and TBR sit side by side). Efficacy shoots up, as both mines use the same infrastructure, while total mined volume will rise exponentially.
So let’s go back to the financials and try to look at some tea leaves to predict the future.
Right now, the company just did 2.2mil tonnes of coal at US$39.45/tonne. The company also reported some earnings from coal trading, and from their mine management agreement with their neighbor AJE. I’ve also noted that these extra revenue generators lifted the gross profit margins from the coal mining segment. (Their GPM figures are higher than that of coal mining)
In my DD, I’ve played with the variables: total tonnage moved for FY17, Average selling prices, and the operating costs, to finally derive a range of possible share prices. It’s kinda cumbersome (and monotonous) to type all that out here though, so I’ll just take the lazy way out and assume the company performs the same for all the subsequent 3 quarters for FY17.
This means that assuming Geo Energy moves 8.8mil tonnes of coal in FY17 (they fail to meet their 10mil guidance), at an average price of US$39.45/tonne (ASP for Q1), approximately, we’ll be expecting US$58.54mil in earnings for FY17.
I’m going to loop off a huge 25% chunk from this for a bit of buffer as the coal prices have since dropped from Q1, and also because we are making some projections and these results are unrealized.
That leaves us with US$43.9mil. The current total share base is 1,212,273,113 shares, but I’m going to use 1,329,273,113 shares instead as the company is going to issue 117mil new shares as part payment for their acquisition of TBR.
That means that the projected full year earnings would be 3.3 US cents per share or SG 4.6 cents. Assuming a conservative PE ratio of 10, we have a fair value of 46 cents.
Obviously all this is contingent on many things going their way. There are so many variables, it’s hard to project with certainty. I think currently, the next major thing to look forward to, is the completion of TBR and the announcement of an offtake agreement.
Currently, I still own 400,000 shares, bought at an average price of $0.157, and upon receiving dividends at the end of May, my average price will be further lowered to $0.147.
Lastly, it’s been exactly 1 month since I’ve implemented a new options strategy. I’ve written about it at the halfway mark:
Bonus From Flyke (!!!) + Results From Enhanced Options Strategy
I’ve since tweaked it a bit to suit my personal style. It’s kinda hard to explain in detail, but it has mainly to do with my thoughts around exercised options. For certain companies, I’m now more willing to recognize exercised options and “book in” profits instead of selling more options on them. That increases my buffer to capitalize on days with bigger swings.
Anyway, the results look like this:

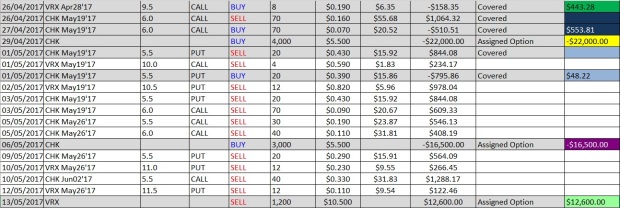
Total cashflow received from 12/04/2017 – 12/05/2017: US$13,657.25
That works out to be a very cool SG$19,120.15 in 1 month!
That’s more than double of my track record previously. I’m still amazed by how tweaking and making tiny changes, can compound and have mega results. Kinda like the butterfly effect. (Theory that something as tiny as a butterfly’s fluttering of wings can eventually lead to a tornado occurring half the globe away)
So much so that it justifies me increasing my allocation gradually. I’d like to see more data than just a single month, but it’s been very very satisfying indeed. Let’s see how it turns out, but at this stage, I’m likely to increase my ammunition here.
VRX has also done wonders with Q1 results and gone ballistic. Ballistic is probably under-describing it. It’s up >50% in the 2 days after ER. Ah, US is just a crazy place.
I haven’t done any calculation regarding my portfolio, but its certainly going to be a stellar Q2. I’m confident that SG TTI has beaten STI ETF in Q2 thus far at least. And I haven’t even received a cent of the dividends that’s all coming in at the end of May.
It’s likely that there’ll be less updates here, going forward. It’s kinda tiring actually to write about stuff. My thoughts obviously move way faster than typing.
As always, happy hunting!

Hey TTI,
With regards to Geo Energy, is the trading segment (sourced from third parties) contributed by AJE mining agreement?
LikeLike
Hey HLB
They didn’t release such specific data, so I’m not 100% certain.
My personal opinion is that the coal traded, does come from AJE.
Geo has 2 agreements with AJE actually:
1 is for the uptake of 5mil tonnes (out of the 30mil tonnes that AJE site holds)
2nd is for mining consultancy services.
All costs of mining and production is borne by AJE, not Geo. The risks associated with execution is on BUMA, not Geo either.
Actually, at first I didn’t even know why AJE needed Geo to begin with. It doesn’t seem like Geo does anything much and gets paid for it!
CEO revealed though, that AJE site is too small (30mil tonnes) such that BUMA doesn’t want to deal with them directly. They also use the same coal seam as Geo, so it’s not economical for them to go it alone. Which is why Geo is getting such a good deal here.
This deal was actually initiated by the family that owns the concession for the AJE site, not by Geo. They want to piggyback on Geo, and are willing to pay an arm and a leg to Geo for it.
Geo gets paid “consultancy services”, and gets coal off take from the AJE site, at a dirt cheap price, which they then resell it to ECTP for a profit. AJE does not have any direct offtake agreement, so they have to rely on Geo. So for all this middleman work, Geo earns a very nice return.
Quantum wise, it’s not big. But I am pleasantly surprised that the profit margins from the consultancy services and the coal trading activities, is actually higher than their main coal mining in Q1.
CEO also said that the main reason why he agreed to work with AJE, was not so much for the sake of the coal, but because they get synergistic effects. AJE has a mined site already. They dig up a hole, and dump it somewhere (dump site). This hole, after completion of mining, needs to be filled back up. Geo’s current dump site is much further away, so Geo is going to use the dug up hole for AJE, that now needs to be filled up, as Geo’s dump site. This cuts down the costs substantially.
That also explains why Geo is only committing to 5mil tonnes now, they gonna open a site, deplete it first, then use it as a dump site.
LikeLike
Thanks TTI. Very insightful and obviously you had access to management for such information! Really helpful for my own analysis!
LikeLike
Oh, Geo’s management is always running public roadshows (although I personally have never attended their roadshow) I did attend an analyst briefing last yr though.
So it’s easy to get access to them.
CEO is also a straight shooter kinda guy. Soft spoken, strikes me as a thinker.
LikeLike
Hi TTI
One question on your portfolio returns page. Why is STI Q12017 return stated as 49.97%? It should be around 10% only I think?
LikeLike
Hi, as of Q1, annualized returns based on XIRR, STI is 49.97%! Crazy as it sounds…
I included the XIRR table for STI ETF in this earlier post:
Basically, it’s a weighted return, meaning that if STI ETF continued rising at the same rate that it rose from the start of Q1 to the end of Q1, by the end of 2017, it’ll be up 49.97%.
STI ETF rose very strongly in Q1, of course it’s highly unlikely for that rate to continue throughout the year, so we should see the XIRR figure drop in subsequent quarters.
Your 10% or so is just looking at the quantum sum, which is not the same as the internal rate of return (XIRR)
You can use a quantum sum way to measure STI ETF, but for a personal portfolio return, it’s not that accurate, cos it doesn’t take into account the time value of your money.
Meaning if you started with $100k, you put in $10k in Feb, and ended the year with $150k, you would say that your return is 50% (including capital injection)
If you started with $100k, put in $10k in Dec, and ended with $150k, you’d also still say your return is 50%.
But that’s not accurate.
Cos in scenario 1, you had the “use” of the $10k for the whole year, whereas in scenario 2, you only had it for 1 month.
So scenario 2’s real, internal rate of return, is actually higher i.e. you got the same quantum despite having used less capital throughout the year.
And since I’m using XIRR for my personal portfolio, I’d have to use the same methodology for STI ETF to make a comparison.
Cheers
TTI
LikeLike
Hi TTI
Thanks for the reply. I’m familiar with the XIRR formula but didn’t realise the returns stated there were the effective annual rates of return, rather than the nominal return which I think people generally use when reporting for a period of time.
Not saying you shouldn’t use XIRR (which you should, for the reasons you’ve already mentioned above), but generally if a party reports a return of x% for Q1, that’s usually the nominal return for three months because annualised effective rate is just a hypothetical rate? I’m still forming my thoughts about this because I had never considered using annualised returns to report for a quarter before. Would appreciate your thoughts on this, say, using a scenario of how your fund manager should report his Q1 performance to you?
LikeLike
Hi
Ah, the thing is, if you’d notice the table I’ve compiled, I used to not even compile any quarterly figures.
It’s all annual.
But I’ve been told I should, and it makes sense somewhat, just to have a sense of where I’m going during the year.
And if that’s going to be the case, if I’m going to compile data periodically (I don’t necessary do it every quarter, it may be any month) then I should be sticking to utilizing XIRR throughout the year, so that the methodology is consistent. It makes it easier for me too, cos there’ll be less work.
It doesn’t make sense to be using nominal figures for each subset of time, and then at the end of the year suddenly tabulate an XIRR return right?
As for the fund manager reporting part, well they utilize a different way of tabulating, it’s not XIRR. I believe they utilize either TWRR, or for unit trusts, they’d use the NAV method (calculating the NAV per unit of the total portfolio)
Both of which are not appropriate for retail investors cos of the complexity.
LikeLike